TV and Digital Are in a Dead Heat for US Media Dollars
October 5, 2016
![]() If we follow consumers across various devices, we find they spend most of their time with TV, in its live and recorded formats. But the tale of TV time spent is actually two separate stories, as explored in a new eMarketer report, “Television Update Fall 2016: Is the Surge in TV Ad Spending a Normal Shift or a Trend?”
If we follow consumers across various devices, we find they spend most of their time with TV, in its live and recorded formats. But the tale of TV time spent is actually two separate stories, as explored in a new eMarketer report, “Television Update Fall 2016: Is the Surge in TV Ad Spending a Normal Shift or a Trend?”
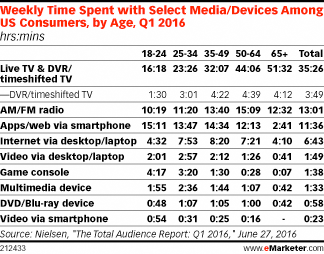
 According to Q1 2016 data from Nielsen, US viewers under the age of 35 spent roughly half as much weekly time in front of the TV than their older counterparts. In fact, the sum of weekly time spent with apps, desktop internet, video, game consoles and multimedia (over-the-top) devices by US consumers ages 18 to 34 exceeded their time spent with live TV. Ad experiences can differ greatly across these platforms. For example, TV commercials fill an entire screen, multiple internet display ads might run on single pages and in-app ads may appear within a game’s background scenes. Regardless, marketers are compelled to be where their targets are, and to take these qualitative ad form and environmental differences into account when pricing the media.
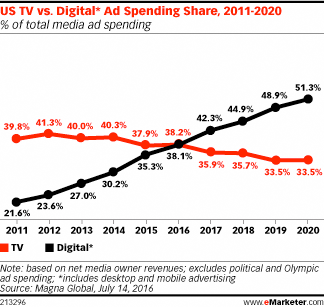
July 2016 data from Magna Global found that US digital and TV ad spending were in a dead heat for share of advertising dollars, with each medium expected to garner about 38% of average media plan budget allocation this year. But digital’s share of media ad expenditures was projected to surpass 50% by 2020, while TV’s portion is forecast to fall to about 33%. Unless the entire advertising pie increases dramatically over the next few years, the expectation under the Magna Global scenario is that TV ad spending will either flatline or decline.
 Magna Global’s figures are in substantial agreement with eMarketer’s forecast that US digital ad spending’s share of total media ad spending will exceed TV’s share for the first time this year, at 36.8% to 36.4%.
Today’s looming question for many advertisers is how best to allocate spending across media given the surge in digital media use. For example, what is the maximum level of digital media investment and at what point do incremental digital dollars result in diminishing returns? Which nondigital media, if any, should be decreased, and by how much? To date, it seems that a sizable portion of dollars has been moved to digital from print and TV media. However, it is virtually impossible to make accurate source attributions in budget shifts, since this information is not publicly available. The dramatic decline in magazine and newspaper ad spending does provide evidence, however, that the bulk of ad dollars came from print media.
A February 2016 study by RBC Capital Markets and Advertising Age indicated that 50% of US marketers surveyed identified spending less on print ads as a way to fund digital ad spending; the equivalent figure for TV was 40%. The decline in traditional print advertising during the past several years has been well documented, especially for newspapers. And the migration of traditional print readership to digital print continues. As Brian Hughes, senior vice president of audience intelligence and strategy at Magna Global pointed out: “Print brands are now digital brands and all traditional media are becoming video media. So you have the Condé Nasts or the Time Incs. of the world investing heavily in video now.”
Courtesy of eMarketer